
Data Analysis – The Power of Excel
Assignment Objectives
- Learn how to use a spreadsheet to record data.
- Use Google Sheets to collaborate with others on data collection
- Move spreadsheets between Google Sheets and MS Excel
- Perform formula calculations on data entered into a spreadsheet
- Generate scatter graphs using MS Excel as a way to explore relationships between types of information
Warming Up! Soxteacher loves baseball!
- A Classic Giants Baseball Moment [VIDEO LINK] [STATS LINK]
- A Classic Red Sox Baseball Moment [VIDEO LINK] [STATS LINK]
- One more awesome moment: [VIDEO LINK] [STATS LINK]
Step 1 – Introduction to Baseball and Baseball Statistics
- baseball record-keeping involves counting what happens
- hits / outs / catching / running = all counted every game
- by recording these events, we can look for trends and compare players and teams
Step 2 – What is Being Counted in this Exercise
- player names
- player ages (years and months)
- singles (1B)
- doubles (2B)
- triples (3B)
- home runs (HR)
- walks (BB)
- sacrifice hits (SAC)
- hit by pitch (HBP)
- At-Bats (AB)
Step 3 – Creating a Shared Spreadsheet
- Within the classroom, break into student pairs.
- Each student should log into the SHP Google account.
- One of the students should create a spreadsheet (“Sheet”) in Google Drive
- Then, the creator of the sheet should add the partner to collaborate as an “editor” on the document.
Step 4 – Entering The Data
- After giving the spreadsheet an appropriate name, each partner should enter their half of the data provided by the teacher.
- This data collection should occur simultaneously.
- There is no need to “Save” the document as it is saved automatically
- There are 12 columns of data for each player
- Each “box” is considered to be a “cell” with an “x” and “y” coordinate. Example: the cell “B4” is in column “B”, row “4”.
- The first row (Row 1) is for the label of each type of information
- Then enter the data for each player on the team. There are 12 players on this team
Step 5 – Processing the Data Part 1
- Now the data can be easily manipulated in a manner that is MUCH FASTER than using a calculator.
- We will create columns of calculations for each player.
- To create a calculated cell, start by typing “=” followed the calculation.
- EXAMPLE – in cell “M2” type “=(C2 * 12)+D2”
- What is entered in the cell will not display, rather the result of the calculation will display.
- Once this is entered into the first cell, yu will want this calculation for all of the players. You don’t have to retype this formula. Rather, copy the cell and paste it to the other cells. The spreadsheet adjusts the formula automatically!
- Repeat this procedure for each of the remaining calculations.
Step 6 – Processing Data Part 2 (list of calculations)
- Total Age in months = (years * 12) + Months
- Total Hits = 1B+2B+3B+HR
- Total Bases TB = (1B * 1)+(2B *2)+(3B*3)+(HR*4)
- Plate Appearances PA = AB+BB+SAC
- Batting AVG = Hits/AB
- On-Base Percentage OBP = [Hits + SAC + BB + HBP]/PA
- Slugging SLG = TB / AB
- OPS = OBP + Slugging
Step 7 – Download Spreadsheet
- At this point, you should download the spreadsheet to your computer for use in Excel.
- In the “File” menu choose “Download as” and then “Microsoft Excel (.xlsx)”
- Each student should open the downloaded file on a separate laptop for the next step of the process
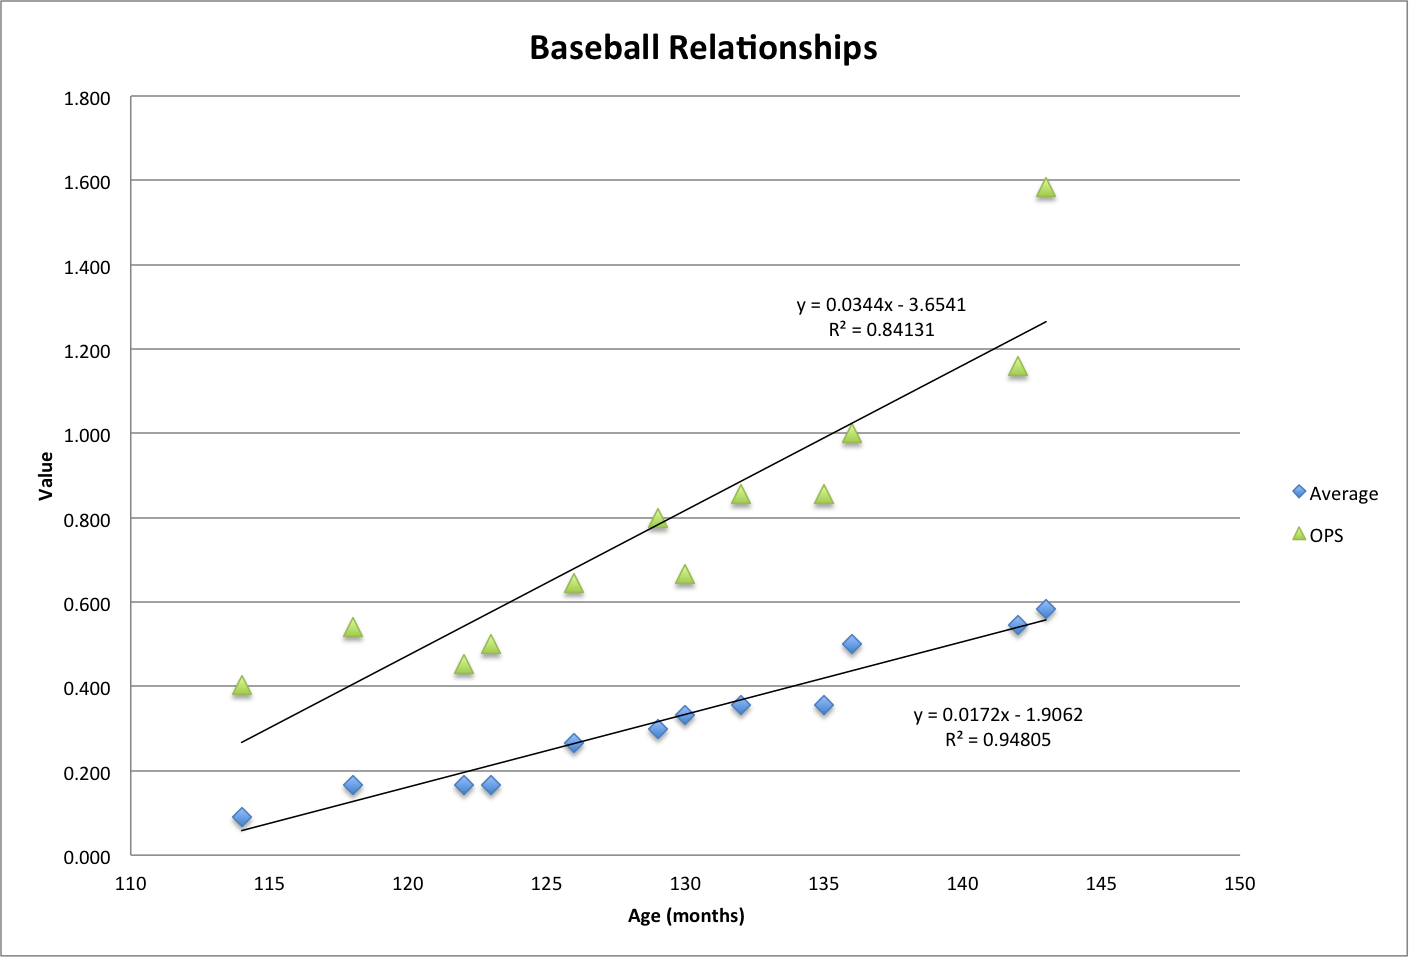
Step 8 – Graphing
- What if I wish to determine if there is a relationship between age and batting average? (Are older players more successful at batting?)
- To determine this, first click on the letter above the “Total Age (months)” column. Then hold the “command” key and click on the “Batting Average” column.
- Then, choose to create a “Chart” and select the type called “Scatter.”
- After selecting “OK,” you will see that a graph has been generated for you with the data.
- Right-click (or “control-click”) the data points for and then select “Add Trendline.”
- Do you see a trend?
- At this point, there are a number of things you can do to make the graph more informative. The overall goal is to be able to visually represent the data in a way so that you can make a decision about the relationship. (see my image at the top of this post)
- Is batting average correlated with age? Is OPS correlated with age? That is the goal of this part of the activity.
- Yes, I know, your calculator can do this. But, it can’t do it this easily and generate something that is so easily edited and saved.
There is a world of help on the Internet for those wishing more information about MS Excel

You must be logged in to post a comment.