
CH32 – Titration Curves

your graph will NOT look like this
Dates
- P1 – Wednesday, April 5th
- P3 – Thursday, April 6th
- P5 – Tuesday, April 4th
Class Activity – Overview
- definition of titration curve
- determine the pH at various points of the titration
- plot graph: x = volume base added (mL), y = pH of solution
- show all work on separate sheets
- for common calculations, may show one type and then summarize
- OK to use spreadsheet but make sure results written on paper
Class Activity – Details
- 0.0783-M NaOH is the titrant
- 0.0844-M HCl is being titrated
- Total Volume of acid at the start = 20.00 mL
- determine the pH of the starting acid solution
- plot graph: x = volume base added (mL), y = pH of solution
Trials – Volume of Base added
- [1-5] = 5.00 mL
- [6-10] = 0.25 mL
- [11-15] = 0.10 mL
- [16-20] = 0.25 mL
- [21-25] = 5.00 mL
Graph Questions (to answer neatly and completely)
- what does the shape indicate?
- how do I know whne the equivalence point is?
- how does volume impact pH as the titration continues?
- what factors impact the shape of the graph?
- 15.4 <it’s a thing>
Homework
- finish all calculations and graph results
- all students should have own copy of supporting work and table
- be ready to hand in paper copy of work
- one graph per group
This is cool
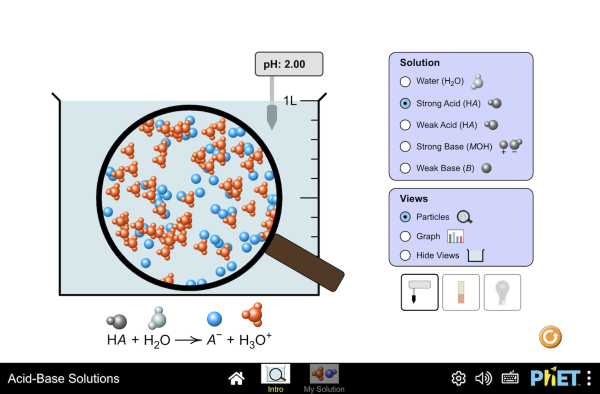
| Click to Run |

You must be logged in to post a comment.